The Analysis Window, is launched from the Spectrogram Window using the Analysis button. It launches the program into its suite of analysis tools. Analysis is carried out in a ‘wizard’-style GUI, where you are guided from one step to the next. Your progress is shown by the presence of tabs at the top of the window. The Next step button moves you to the next step of analysis.
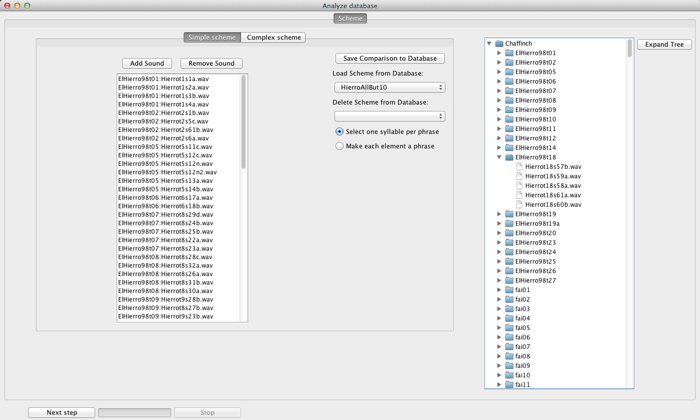
The first window in the sequence is shown above. It has two components. On the right is a view of the database (similar to that found in the Database Window), which you use to select sounds that you wish to analyze. On the left is the Comparison scheme panel. This shows what sounds you have selected to analyze. There are two types of comparison schemes. Simple schemes involve one list of sounds, all of which get treated in the same way. Simple schemes are suitable for most general-purpose use. Complex schemes provide a more flexible design for which sound gets compared with which. Complex schemes are suitable for experimental designs, like tutor-tutee experiments in which, out of the list of all songs, only certain comparisons are of interest. Complex schemes have a narrower range of post-comparison analysis options available for them, however.
When a comparison scheme has been selected, and Next step clicked, the following window appears (after a few moments):
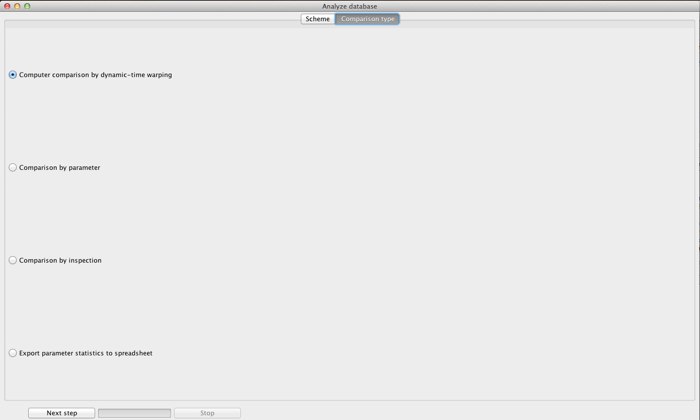
This window provides the different types of analysis found in Luscinia. These comprise:
1) computational comparison using Dynamic Time Warping
2)computational comparison by Multivariate parametric methods;
2) human comparison of sounds based on inspection of spectrograms (or sounds);
3) exporting measures to a spreadsheet.