Animal signals are often syntactically structured - that is they consist of a sequence of sub-units, and this sequence obeys certain rules. Luscinia provides methods to find such statistical dependencies and measure the degree of syntactical structure. The algorithm that does this is a hybrid of the PAM k-medoids clustering algorithm and first-order markov chain entropy. Together these solve a conundrum in such studies: to measure syntactical structure, elements already have to be categorized. But how elements are categorized might depend on their syntactical dependencies. Luscinia’s algorithm clusters notes according to their proximity to centroids, but identifies centroids by finding those that maximize syntactical redundancy. A forthcoming paper will describe this method in proper detail. Note: this algorithm is perhaps the most computationally intensive of those in Luscinia, and even with optimization may take several hours for large datasets (1000 data points+).
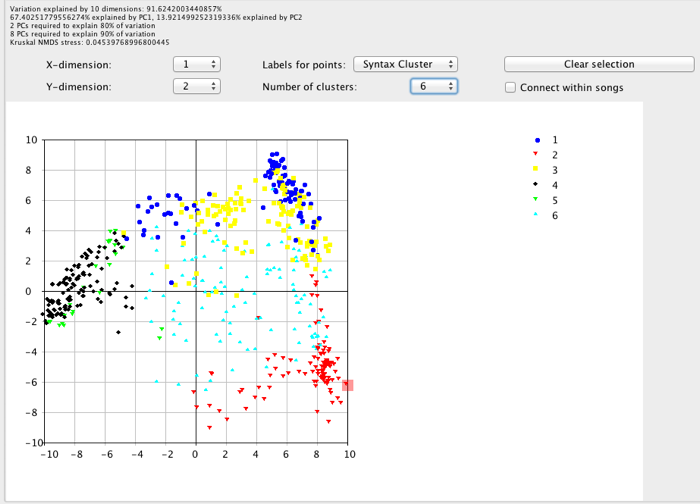
The results of syntactical clustering are presented in a very similar way to K-medoids clustering. Syntactical classifications of syllables or elements are displayed in NMDS plots. They are accessed via the Labels for points drop down menu, under the selection Syntax Cluster. The number of syntactical clusters displayed on the graph is likewise controlled by the Number of clusters option.
The Number of clusters analyzed is varied using the Maximum K syntax clusters option in the Analysis and Visualization window.
Luscinia estimates the syntactical structure by calculating redundancy - a parameter scaled from -1 to 1. Redundancy of 0 means that there is no syntactical structure, while 1 indicates that there is maximum syntactical structure. It can be estimated using two different algorithms: 1st order Markov chain entropy or Sliding Window Match Length. These can be chosen between under the Syntac Methods drop down list in the Analysis and Visualization window. The results of these calculations are shown in the Statistics tab.

Three statistics are shown (two for Markov entropy estimates): 1) Redundancy estimates for each value of k in the analysis. Then, for the k with the highest value of redundancy, two further statistics are calculated: 2) Individual Deviations. In this ones, swml estimate are calculated by treating the match length between two songs as a measure of similarity between them. From these, a syntactic distance score can be calculated between each pair of individuals in the population. From this, a PCO analysis can be used to ordinate the data and calculate a population centroid. Finally, the distance to this centroid can be calculated for each individual in the population. The output shows this deviation score. In a population with weak syntactical structure, these values will be higher than for a population with strong structure, and they can be statistically compared using normal methods. 3) Bootstrap estimates of redundancy. Individuals are resampled, and redundancy recalculated. The output provides the values of different percentiles in the bootstrap distribution, which can also be the basis of statistical comparison between data-sets.
This page of the manual will be updated once publications on the method have appeared.