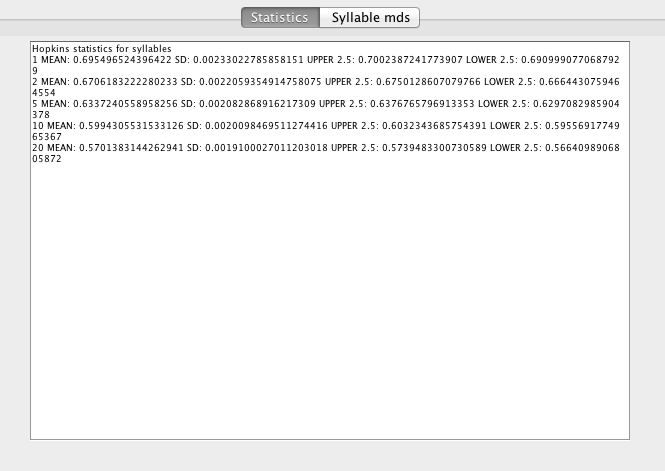
Hopkins statistic is a simple measure of clustering tendency. It compares nearest-neighbor distances in the data-set with nearest neighbor distances in data-sets simulated from a multivariate Normal distribution. By repeating the simulation many times, an estimate of the probability that the observed nearest-neighbor distances could have been obtained from the random distribution can be obtained. Hopkins statistics >0.5 indicate clustering in the data. They do not inform the user about how many clusters are present. In Luscinia, the statistic is estimated for various nearest neighbor distances: the 1st, 2nd, 5th, 10th and 20th nearest neighbors. If ‘clustering’ just depends on sharing between pairs of syllables, then the prediction is that H will be >0.5 for 1st or 2nd nearest neighbors, but should decline to 0.5 for 10th or 20th nearest neighbors.
The output of the analysis is provided in the Statistics tab. For each of the nearest-neighbor analyses, the mean value of the statistic is provided, along with the standard error of the the estimate, and upper and lower 95% confidence intervals.