Luscinia offers a variety of ways to display the outcome of such sound comparisons, and to export the comparisons to other analysis programs. These options are displayed in a list in the parameter setting window (on the right hand side of the window). For each type of analysis/display, there tend to be three alternatives: one for each of the hierarchical levels of analysis (element, syllable, song).
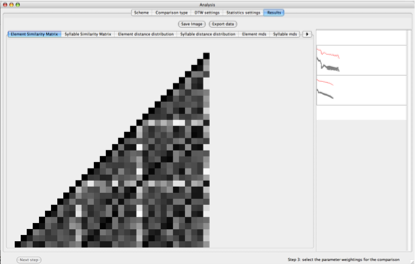
Distance matrix. The first general type of display is the distance matrix. This option simply displays the distance scores as a grid of squares that are shaded according to a grey scale: black means that two acoustic units are very similar, white means that they are very different. The matrix is triangular since there is only one comparison score for each pair of units. The scores can be assessed by clicking on the squares. Doing so will display an outline “spectrograph” of the two units to the right of the matrix.
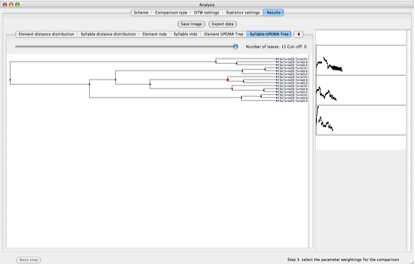
UPGMA cluster analysis. UPGMA is a very simple agglomerative clustering algorithm that eventually generates a tree representing the relationships found in the distance matrix. Considerable discussion of the strengths and weaknesses of the UPGMA algorithm can be found in the literature. A major motivation for using it in Luscinia was that it is very simple, and therefore very fast, allowing the calculation of large trees.
The trees generated by Luscinia are also interactive. If you click on the tree, the nearest node will be highlighted, and spectrographs of each of the leaves of the tree will be displayed to the right of the window. The tree can also be compressed by moving the slider at the top of the window. This can be useful if a large tree is produced.
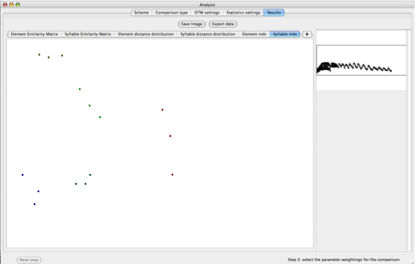
NMDS analysis. NMDS is another classic algorithm (related to PCO and PCA). Very simply, it attempts to find a finite number of dimensions that best represent the relationships found in the distance matrix. In Luscinia, a very classic implementation of NMDS is included: first the eigenvalues & vectors of the matrix are established, then NMDS is carried out according to Kruskal’s original formulation (1964).
Luscinia represents NMDS analysis as a two-dimensional scatter plot (further dimensions may be calculated and exported to a spreadsheet, however). As before, if you click on the window, a spectrograph representing the nearest acoustic unit in the window will appear on the right hand side of the window.