Although computational algorithms such as DTW are increasingly accurate, and are fast enough for comparisons of large datasets, there remains a place in bioacoustic analysis for inspection of spectrograms or sounds by human observers. Probably the majority of studies of complex acoustic signals, like bird song still rely on this technique.
There are a number of logistical problems with visual analysis: first you end up producing great piles of paper. Second, there are numerous opportunities for errors: in studies that I have participated in, these include errors by the observers in filling in the correct row and column of their score sheet, and also transcription errors by the person transferring the results into a spreadsheet. These logistic problems are exacerbated if you wish to follow best-practice and have multiple observers score the spectrograms. Moreover, print-outs of spectrograms are a very limited representation of the sound. The observer may wish to change the properties of the spectrogram, zoom in on a certain part of the spectrogram, or even listen to the sound.
Luscinia attempts to include such possibilities by allowing on-screen visual analysis of sounds. The basic idea of this is as follows:
1) The principle investigator adds sounds to a database, and measures syllables in those sounds.
2) Next, she creates a comparison scheme for these sounds, as appropriate
3) She rounds up some volunteer observers, and creates user accounts for them in Luscinia for this database.
4) The users start Luscinia, follow the links to Visual Analysis, and carry out the visual comparison of the scheme. Their results are automatically saved into the database
5) The principle investigator retrieves the results of the observers' comparisons from the database, and saves them into a spreadsheet for further analysis.
There are two different forms of Comparison by Inspection, corresponding to the simple and complex schemes. Briefly, in complex comparisons, all comparisons in the scheme are carried out. In simple comparisons, when two sounds are scored as identical, one is removed from further comparisons. This is equivalent to the task of making piles of spectrograms corresponding to different song-types.
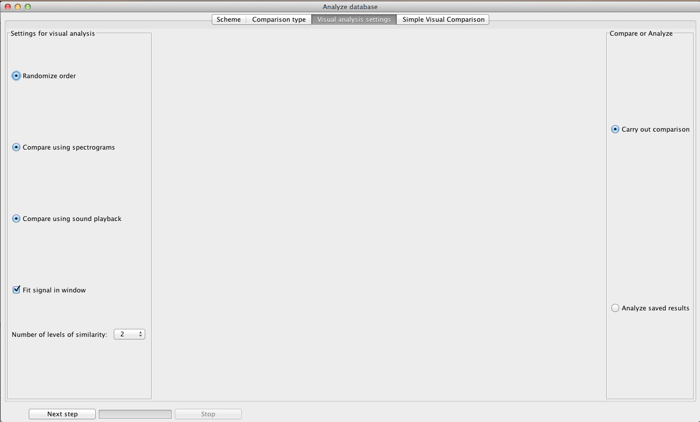
Several settings for Comparison by Inspection are available, shown on the window above, which is the window first shown after the Analysis Window.
Randomize order randomizes which order pairs of spectrograms from the comparison scheme are presented.
Compare using spectrogram means that a spectrogram of the sound is presented. If this is switched off, a wave form representation of the sound is presented instead, and the user is expected to rely on sound playback.
Compare using sound playback if this is selected, users are able to play back the sounds, or individual syllables from the sounds. This can be used in addition to spectrograms, or on its own.
Fit signal in window. If this is selected, the spectrogram is scaled to fit inside the screen. If it is not selected, it may extend beyond the width of the screen, requiring the user to scroll horizontally to view the whole signal.
Number of levels of similarity sets the granularity of users’ assessment. e.g., if it is set to 5, users will have 5 levels of similarity to choose between.
In addition, for Complex Comparison Schemes only, users can specify to compare songs by syllable, or at a whole-song level (or both).
From this window, users can either start a comparison by pressing Carry out comparisons, or can download the results of earlier comparisons of this scheme using Analyze saved results.
