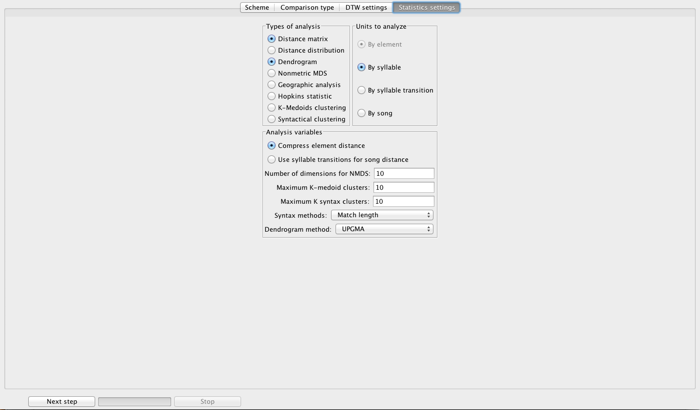
Luscinia offers a variety of ways to display the outcome of such sound comparisons, and to export the comparisons to other analysis programs. The screen above appears after having carried out a DTW or Parametric comparison using a Simple Comparison Scheme.
At the top left, there is a list of different types of analysis. Each is addressed in a separate page in the manual under this one.
At the top right, there is a list of different levels of analysis - from individuals to entire songs. Of these, syllable transitions is the only one that is perhaps not self-explanatory. A syllable transition is defined as a pair of phrases that occur next to one another within a song. Analysis by syllable transition is therefore one simple way to analyze syntactical structure within songs.
At the bottom is a list of various parameter settings, pertaining to different analyses.
Compress element distance reduces the number of elements in the analysis by calculating average dissimilarities for each element that occurs in the same position for different syllables in the same phrase.
Use syllable transitions for song distances calculates similarities between songs based on syllable transitions. If it is not selected, song distances are calculated based on syllable dissimilarities instead.
The other parameters will be discussed with the analysis methods to which they apply.
The results of analysis are shown in a separate tab. Each of these will be discussed along with the appropriate analysis below. Common to all result screens, however, are the Save image and Export data buttons at the top of the tab:
Save Image exports a visualization of the data to a graphics file (jpg, png). Export data exports the results of the analysis to a spreadsheet format for further analysis.
