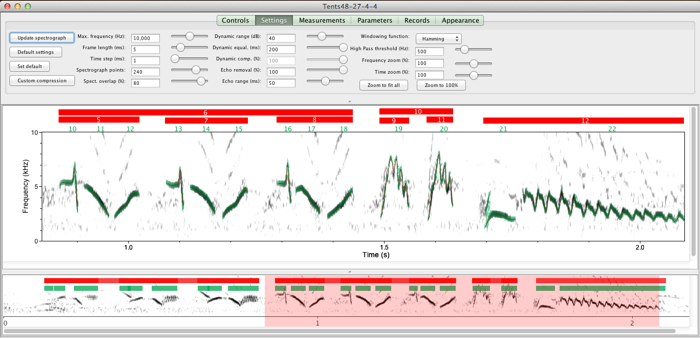
Luscinia creates spectrograms using an FFT algorithm. Although you can also play sounds, and save your spectrogram as an image file, the main purpose of the spectrograph window is to measure sounds and store the measurements in the database.
The spectrogram window is divided into three parts. The upper part contains the controls. The middle part contains the main spectrogram itself. The lower part contains a smaller "navigation spectrogram” of the entire sound.
The Navigation Spectrogram
The navigation spectrograph is a low resolution spectrograph of the entire signal. The pink rectangle indicates which region of the sound is currently displayed in the main spectrograph. If you click on the navigation spectrograph, the rectangle, and the focus of the main spectrograph moves to where you clicked. You can also “drag” the mouse inside the navigation spectrograph to set the limits of the main spectrograph - a handy way to zoom in and out in the time domain. Note that when you zoom in this way, you are not altering the frequency or time resolution of the FFT underlying the spectrograph: instead the image that is produced by the FFT is stretched or compressed to fit into the window (this is the same as what happens in the zoom section below).
The Main Panel
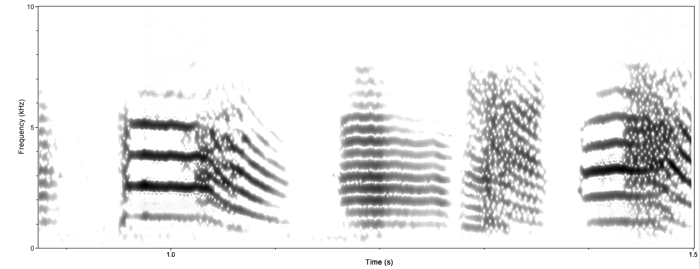
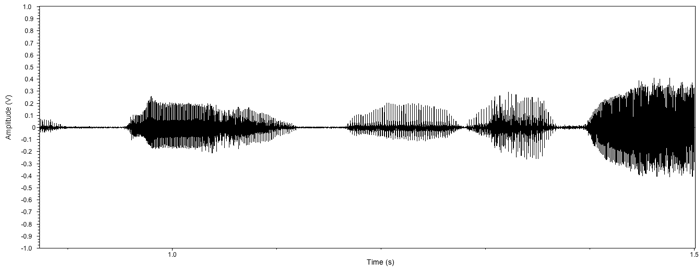
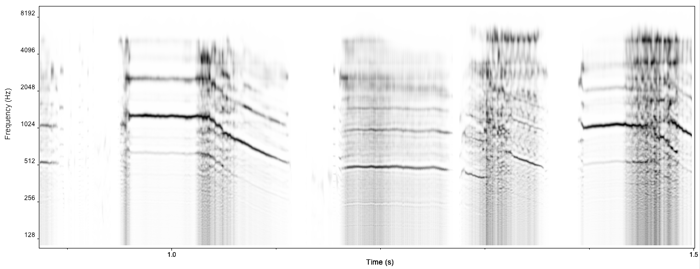
The main panel displays one of three representations of the sound, which can be toggled in the Controls panel. Below is an example of the same sound shown under the three representations:

1) an FFT spectrogram of the part of the sound that is indicated by the navigation spectrogram. Time runs on the x-axis, and frequency on the y-axis. Intensity is measured on the greyscale from black (high intensity) to white (low intensity). Various measured units of the sound will be superimposed on top of the spectrogram.

2) the waveform of the sound segment. Here, the amplitude of the sound is represented on the y-axis, centred around 0V.

3) the "pitch display". This is the most derived of the three representations. It is calculated from the spectrogram. "Pitch" is a psychological term that is related to fundamental frequency. In this display, the strength of support for different fundamental frequencies is shown. It is calculated from the following algorithm. Note that frequency is now on a logarithmic scale. For harmonically structured signals like the zebra finch song shown above, this view may provide a more informative view of how the signal varies.
As of this version of Luscinia, measurements should be made using the spectrogram display.
The Controls Panel
The controls panel consists of five “tabbed panes” that contain all the parameters and settings for the spectrogram. These will be dealt with in turn in the following pages:
"Controls"
"Appearance"
"Measurements"
"Parameters"
"Records"
“Appearance”
