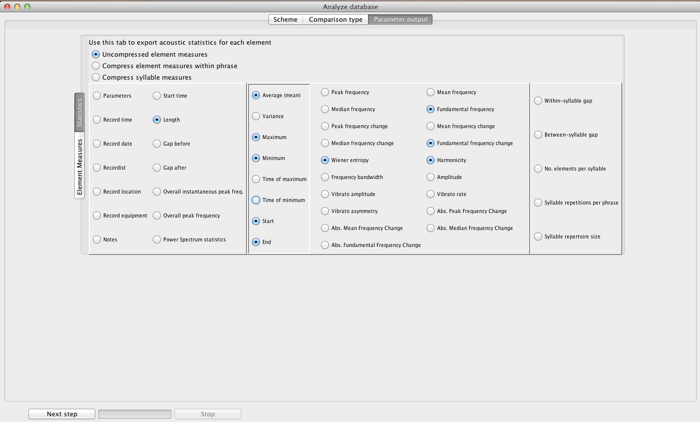
“Statistics” This pane gives you options for saving summary statistics about elements and syllables. Data can be exported in common text and spreadsheet formats (.txt, .csv, .xls).
At the top, three options are listed that make use of the organizational information Luscinia knows about the recording based on the syllables it has stored in the database. “Uncompressed element measures” exports details about every single element. “Compress element measures within phrase” will export element measures, but will average within a phrase to create one value for each element within a syllable (e.g. if one phrase consists of six repeated syllables, each containing 3 elements, there will be three rows of measurements exported to the spreadsheet file – one for each of the three element-types). Finally, “Compress syllable measures” will average these scores within the syllable to create scores for the entire syllable.
Underneath these options are four panels next to each other. Most of the entries in these fields relate to acoustic measurements made on spectrographs that is discussed in the spectrogram window section.
On the left-hand side is a list of basic information about the element. Only a few of these options require further comment. “Gap before” and “Gap after” refer to the temporal gap before and after elements respectively. For the first and last elements of songs a value of -10000 is inserted for Gap before and Gap after respectively. If compressed output is selected, these initial and terminal values are omitted entirely from the calculation.
“Overall instantaneous peak frequency” and “Overall peak frequency” are two measures of the peak frequency that have not been mentioned before. “Overall instantaneous peak frequency” is peak frequency at the point within the element where the intensity is greatest. In other words, Luscinia first searches through the element to find the peak amplitude, and then measures the peak frequency at that point in time. “Overall peak frequency” is frequency at which there is most energy throughout the element. It is therefore calculated in a slightly different way. First Luscinia creates a power spectrum for the element via the crude method of summing individual power spectra for each time slice in the element. Then the peak frequency in this overall power spectrum is found.
The second panel is a list of summary statistics that can be calculated and exported for each of acoustic measure. If ‘mean’ is selected in this panel, the mean value of each of the acoustic parameters in the third panel is calculated and exported.
The third panel contains a list of different acoustic measures that are discussed in the “Spectrograph window” section.
Finally, on the right hand side is a list of various organizational measures that pertain only to syllables. Syllable repertoire size is calculated by carrying out a UPGMA clustering algorithm on the output of a computer comparison if each of the elements in each birds repertoire.
