K-medoids clustering carries out a clustering analysis of the data. The k-medoids algorithm is related to k-means, but uses individual data points as cluster centers. It is appropriate for analyses of highly dimensional data, especially when there are many points per cluster.
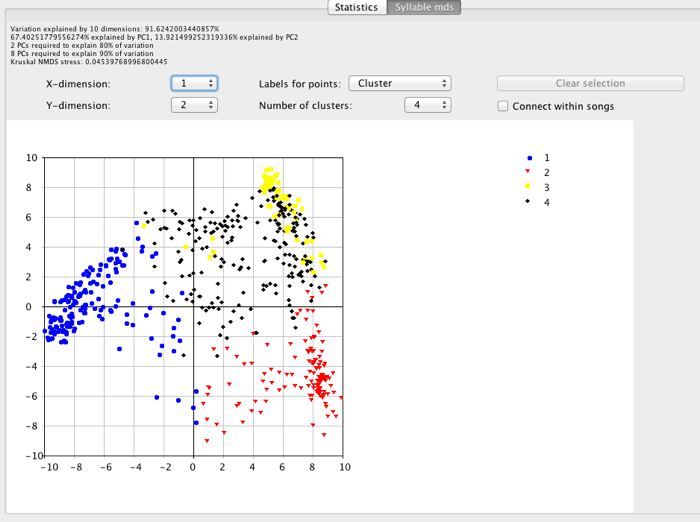
The results of the analysis are visualized using the NMDS plot. Therefore it is normally recommended to select Nonmetric MDS as well as K-medoids clustering from the Analysis and Visualization window. There is one option associated with the analysis: the number of dimensions that the algorithm analyzes. This is labeled Nummber of K-medoid clusters in the Analysis and Visualization window. On the NMDS plot, the output of the k-medoid analysis can be seen by selecting Cluster from the Labels for points drop down list. Then Number of clusters can be used to display clustering solutions for different values of k.
The classifications made by the k-medoid analysis can be exported to a spreadsheet by clicking on Export from the NMDS screen.
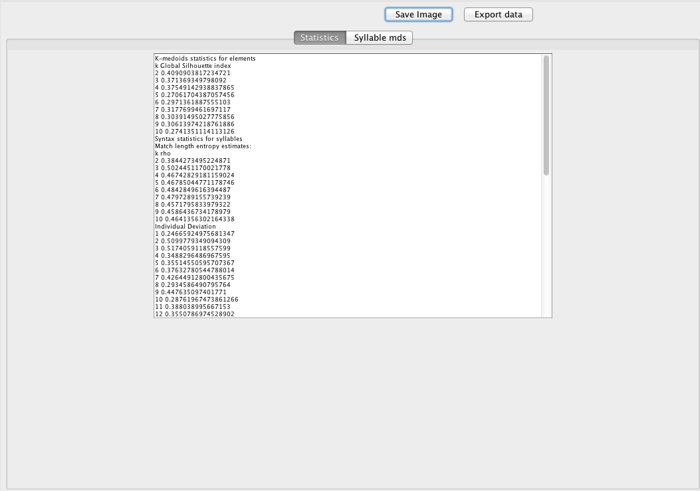
In addition to displaying the classifications made by the algorithm, Silhouette Indices of cluster validity are calculated and are displayed under the Statistics tab in the results:

High values of the Silhouette Index indicate clustering solutions that represent clear clusters.
