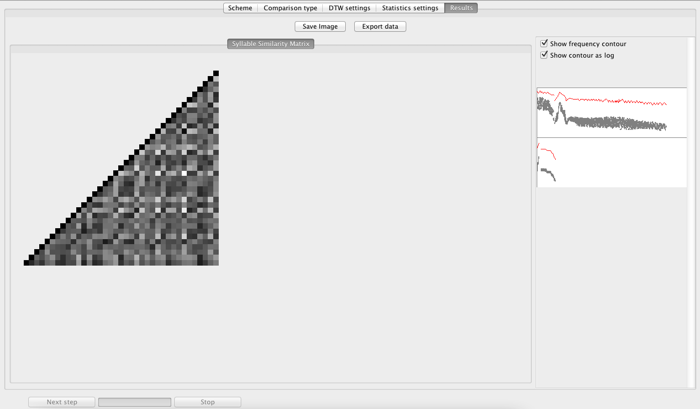
The Distance Matrix view shows a simple matrix of dissimilarities, color coded on a grey scale. Black means high similarity, and white means high dissimilarity. Note the diagonal line of black cells, corresponding to comparisons of signals with themselves.
If Export data is clicked, Luscinia will export the raw dissimilarity scores to a spreadsheet or text file.
The display is interactive. If you click on a particular cell in the matrix a sketch of the spectrograms of the two signals (in the case above, syllables) will appear on the right hand side of the window.
